When is a website considered down
26 Jul 2018
...as opposed to just slow?
**UPDATE 2 Feb 2021** This survey is still as relevant as ever, but we have now added a new study on response time based on practical results from a million responses from real websites.
When you visit a webpage that is down, most of the time you'll see an error: you'd see a 404 error if the page can't be found or a 503 if the server isn't unavailable.
Although this is not what you want to see, it is helpful. You know that the site is down and have a rough idea why.
But sometimes you don't see an error... just a spinning wheel.
You may wait for 5 seconds, or 20 seconds, or a minute but at some point if the webpage doesn't appear, you'll decide that the site is not just slow, but down.

Timeout Threshold
Downtime Monkey's monitoring scripts go through the same decision-making process.
If a server is running so slowly that it doesn't respond, at some point we have to call time and mark the site down.
The question is: "How long should we wait?"
Experimenting With Timeout Threshold
Over the past few months we have been varying the timeout threshold.
We've used various times betweeen 9 seconds and 30 seconds and examined the effect the changes have had on the efficiency and run-times of our monitoring scripts.
The aim was to find the timeout setting that allowed our monitoring scripts to run most efficiently and quickly, and set timeouts to this value.
Speed & Efficiency
We found that the monitoring scripts were quickest and most efficient when the timeout setting was lowest - this isn't surpising really but it forced us to re-think our approach.
If we dropped the timeout setting further the scripts would run faster still - in theory we could set timeouts to 1 millisecond and the monitoring scripts would be super fast. However, websites would constantly be marked as down when they didn't respond in time.
Obviously, it is unreasonable to expect a website response within a millisecond - but this poses the question: "What is a reasonable timeout setting?"
New Approach
Instead of choosing the timeout threshold that lets our monitoring scripts run fastest, we decided to use the value that is most widely considered appropriate.
So we set up a survey asking: "How long without a website response before you consider the site down, as opposed to just slow?"
The options for answering were: 5 seconds, 10 seconds, 20 seconds, 30 seconds and 1 minute.
Google+ was chosen because of the high response rate to polls.
We polled 9 Google+ communities (details here) with specific communities being selected because of the appropriate knowledge of the community members and their enthusiasm for past polls.
Thanks to everyone who took part!
Survey Results
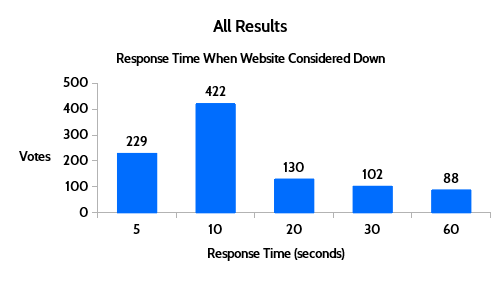
Here are the full results from all polls combined:
Total Votes:
971
5 sec:
23.58%
10 sec:
43.46%
20 sec:
13.39%
30 sec
10.50%
1 min
9.06%
Mode Timeout
10 sec
Mean Timeout
17 sec
Mode and Mean
The most popular choice (the mode) was 10 seconds.
The average time (the mean), taking all votes into consideration, was 17 seconds.
It's noteworthy that 10 seconds was the most popular choice by a considerable margin and that this result was repeated across all individual polls: in every community 10 seconds was the most popular choice.
The distibution of votes was also very consistent across the individual polls - we were surprised at how reproduceable the results were. In every poll the mean time was between 16 and 19 seconds.
You can see results from each individual poll towards the end of the post.
Putting The Results Into Practice
We have now set the timeout threshold on all our monitoring scripts to 17 seconds, the mean choice of all votes.
It's true that our scripts would run slightly faster if we used a lower timeout but we believe that this is the most appropriate timeout setting for our users, based on the opinions of the tech/developer/designer community.

What Happens After A Monitor Times Out?
When a monitor passes the timeout threshold without a response, the site is marked as down and the event is recorded with a response code of 0.
Stats for the monitor are automatically updated to take the downtime into consideration.
Pro users can view all individual timeouts, and will see the explanation: "No Response: No HTTP code was received. Possible reasons for this are timeout (the server is not responding in time) or being blocked by a firewall."
SMS and email alerts will be sent if the site remains down for the time specified by the user in their alert settings.
Free users receive SMS alerts instantly and email alerts if the site stays down for one minute. Pro users can set their own custom alert times.
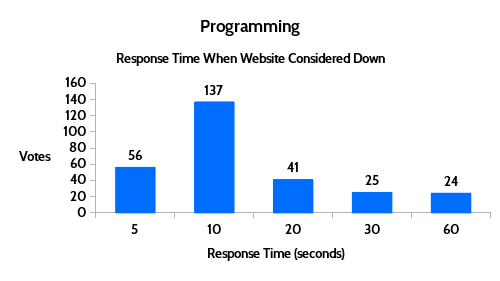
Results From Specific Polls
Programming
Number of Votes:
283
Mean Timeout:
16 seconds
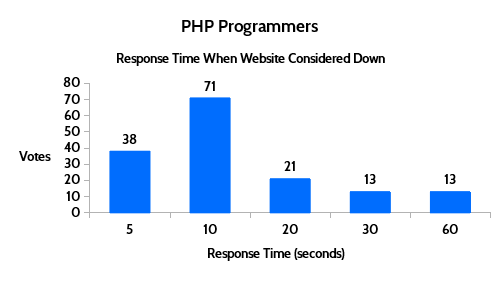
PHP Programmers
Number of Votes:
156
Mean Timeout:
16 seconds
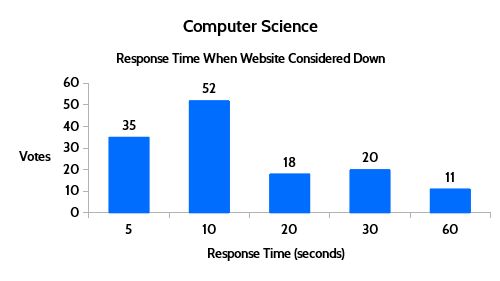
Computer Science
Number of Votes:
136
Mean Timeout:
17 seconds
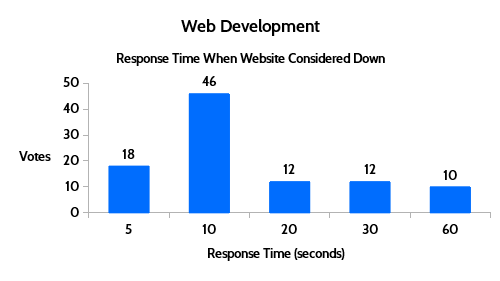
Web Development
Number of Votes:
98
Mean Timeout:
18 seconds
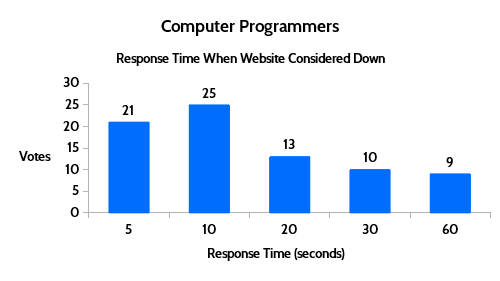
Computer Programmers
Number of Votes:
78
Mean Timeout:
16 seconds
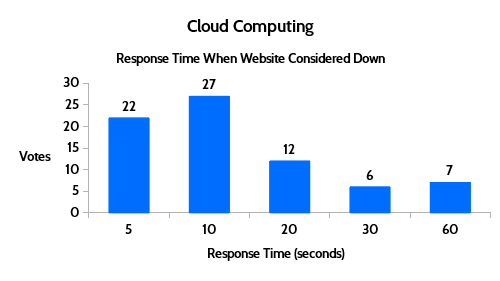
Cloud Computing
Number of Votes:
74
Mean Timeout:
16 seconds
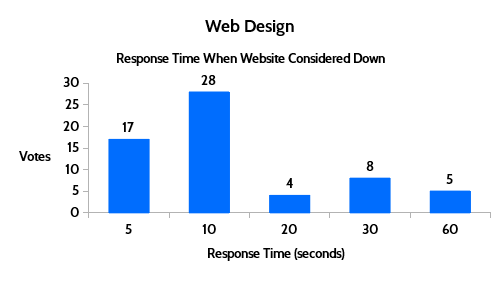
Web Design
Number of Votes:
62
Mean Timeout:
16 seconds
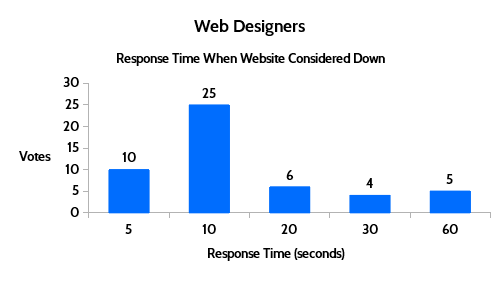
Web Designers
Number of Votes:
50
Mean Timeout:
17 seconds
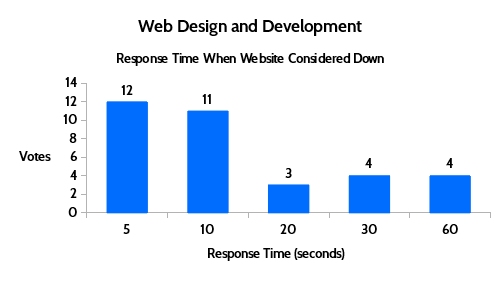
Web Design & Development
Number of Votes:
34
Mean Timeout:
17 seconds
Defining Response Time
You may already have asked: "How is response time evaluated?" Good Question.
'Response Time' is not 'Page Load Time'
It's important not to confuse response time with page load time when considering the question: "How long without a website response before you consider the site down?"
Response time is always much quicker than page load time - read on to see why...
What happens when you visit a webpage
When you visit a website your computer sends a request to the web server, asking for the webpage data.
The server sends a response, which includes a status line, HTTP headers and webpage content.
The first thing that is received by your computer is the status line - this is just one line and contains only a few bytes of data. It tells your computer whether the request was successful or not.
Next, your computer receives the HTTP headers which contain details about the webpage - these are several lines long and typical headers size is 700-800 bytes (although they can be anything from 200 bytes to over 2KB).
Finally, your computer receives the webpage content - the data size varies considerably depending on the webpage but is usually in the megabytes. In 2017 the average webpage size was 3.034MB - that's over 3 million bytes!
Time To First Byte
Time to first byte (TTFB) is the time taken to receive the first byte of data of the status line (technical details here).
TTFB is sometimes used for response time. However, we don't think this is accurate because it's not the same as "the time of the first data byte of the page" appearing in the web browser.
Page Load Time
Page load time is "the time it takes to download and display the entire content of a web page in the browser window".
This is irrelevant to response time because content-heavy web pages can take a long time (sometimes minutes!) to fully load.
Time To Receive Headers
We consider the time taken to receive headers is the most practical measure of reponse time - headers are received just before the first content is loaded to the web browser. This is used to record response time in our monitoring scripts.
All Posts
Website Monitoring Prices Compared
Scheduled Maintenance 17th June 2021
US Text Alerts Updated For 10DLC
A Quick Study Of Response Time
'Early-bird' Discount Ends November
Downtime Logs... All In One Place
The Effects Of COVID-19 Lockdowns
Lockdown Bugfixes & Midnight Coding
Monitoring URLs With Query Strings
New Pro Plans For EU Individuals
Free & Pro Monitoring Compared
Downtime Alerts: An Ideal Custom Setup
Server Upgrade & IP Address Change
Website Monitoring: Cheap vs Free
Website Content (Keyword) Monitoring
Cheap Website Monitoring Pro Plans
Server Upgrade Scheduled Completed
Whitelist Email Addresses in cPanel
Website Downtime Alerts To Slack
Whitelist Email Addresses: Thunderbird
Whitelist Email Addresses in Yahoo Mail
How we improved accessibility by 42%
Whitelist Email Addresses in Outlook
Whitelist Email Addresses In Gmail
Why Whitelist An Email Address?
When is a website considered down
Bulk import, edit and delete monitors
Privacy, democracy & bureaucracy
How Much Downtime is Acceptable?
Server Upgrade Scheduled Completed
Free Plan Upgraded to 60 Monitors
New Feature: Rate Limit SMS Alerts
How We Boosted Page Speed By 58%
How To Reduce Website Downtime