How We Boosted Page Speed By 58%
17 Jan 2018
...and how you can too!
**UPDATE 4 Oct 2019** This post has proved very popular and is as relevant today as ever. If you want to keep track of your webpage speed, check out our website monitoring service - the free plan includes response time monitoring for up to 60 websites, round the clock.
Over the past couple of weeks we've been optimising the Downtime Monkey website to reduce page load time. We've had some excellent results: in the best case scenario we cut page load time by 58% and even in the worst case, the page load was still 9% faster.
All of the changes that were made are straightforward and we've provided in-depth details of the optimisations so that you can apply them to your own website.
NEW CASE STUDY: our latest case study focuses on web accessibility and provides in-depth instructions with code snippets. Check it out: How we improved web accessibility... and how you can too!
Starting Point
Our starting point was a site that was already developed to be light. All the code was hand-written from scratch using: our own CSS framework as opposed to Bootstrap, vanilla JavaScipt as opposed to jQuery, no PHP framework and no CMS.
Images had been used sparingly and the filesizes kept small.
However, we'd not optimised specifically for page speed so we were hoping for some improved performance.
Selected Pages
To find our starting point we chose two different pages to use as benchmarks:
1) The 'Plans' page: https://downtimemonkey.com/en-us/website-monitoring-plans.php
2) The 'Home' page: https://downtimemonkey.com/en-gb/index.php
The Plans page was selected because it was a good benchmark for many pages on the site: it had an average amount of text, fonts and images.
The Home page was chosen because it is the main landing page and therefore is important from the perspectives of 'first page load' and SEO. It's also one of the heaviest pages on the site with a large header image and embedded YouTube video.
Also note that the Plans page is specifically for the US (see /en-us/ in the URL) and the Home page is specifically for the UK (/en-gb/) - we wanted to benchmark from different locations across the world so it is vital to use the correct landing page for each location.
Note that 'hreflang' is used so that Google search results serve the correct page for the location therefore removing the need for users to be redirected to their country specific page. This is important from a page speed perspective since redirects cost time and are best kept to a minimum.
To get detailed load time data we went to Web Page Test, entered the URL and hit 'Start Test'. For the Plans page test location, we selected a US location and for the Home page we chose a UK location.
Benchmark Load Times
These benchmarks are the load times before optimisation took place - the load times after the optimisations are shown in the results section at the end of the post.
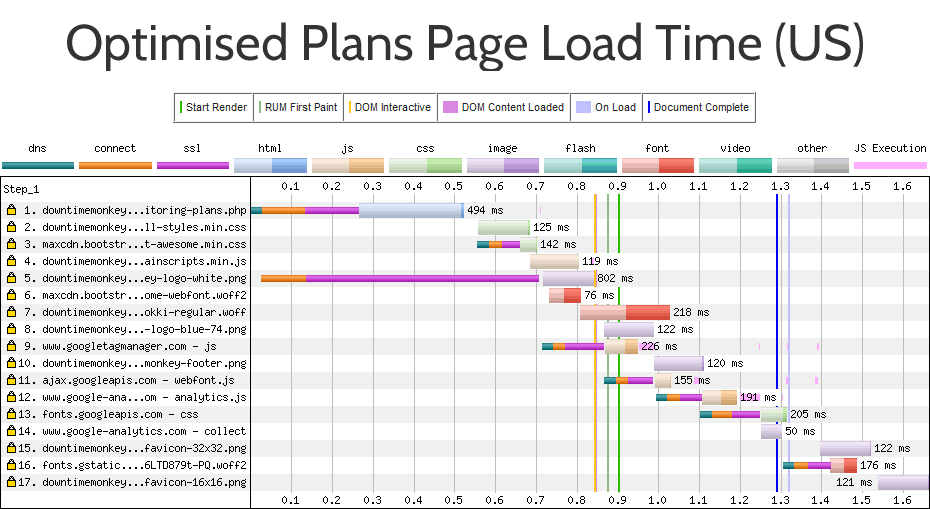
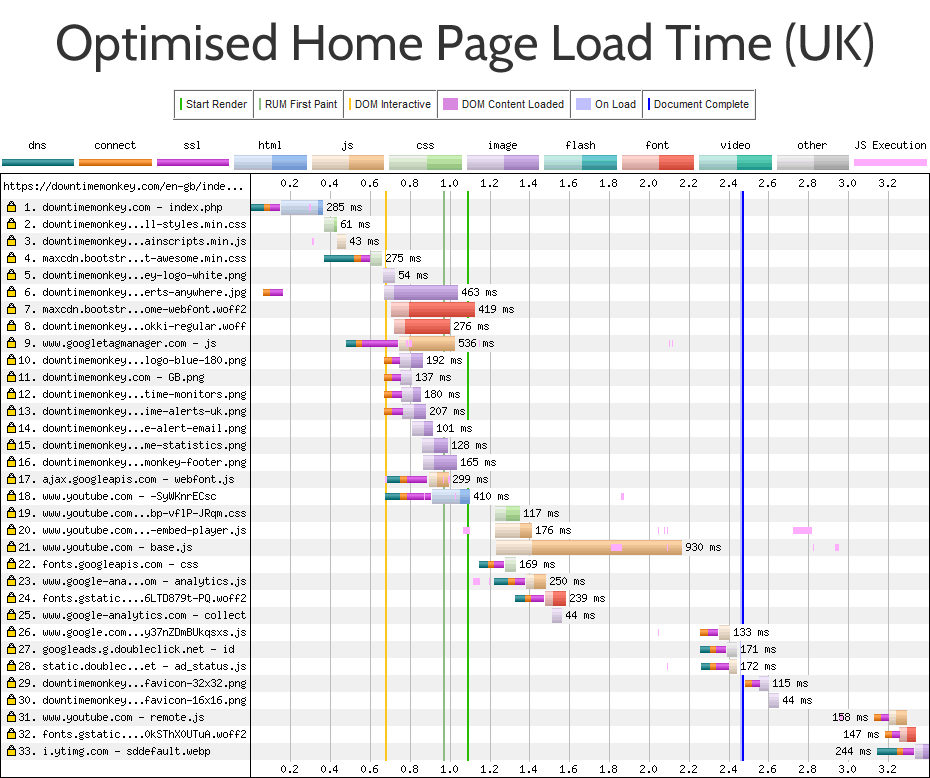
Plans Page: 2.105 seconds, Home Page: 2.712 seconds
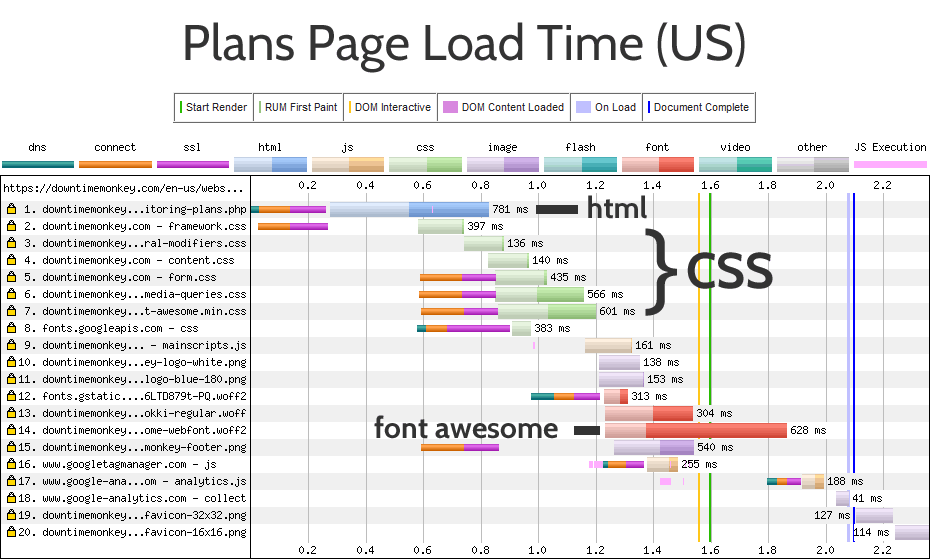
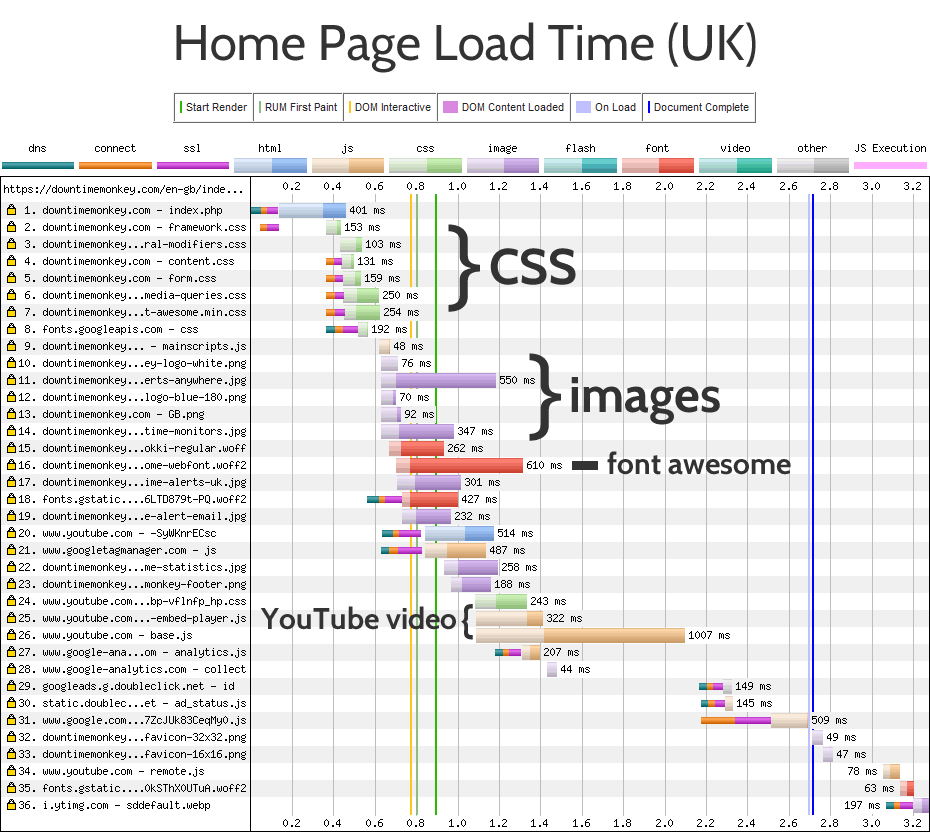
The waterfall diagrams show the page load times broken into different requests - this helped identify the slowest parts of the pages to load:
1) Font Awesome is slow to load on both pages - taking over 600ms.
2) There are too many CSS files. Because there are multiple files and each one requires its own request to the server they really slows things down.
3) Images reduce speed on the home page, especially the large header image.
4) The slowest aspect of page load is the embedded YouTube video, however, it turns out that this is not a major issue (find out why later in the post).
Recommended Optimisations
With the bottlenecks identified we headed over to Google Page Speed Insites, entered the URL and hit 'Analyze'.
Page Speed Insites gives recommendations for ways to increase page speed. Read on to see the actions that were taken...
Consolidate and Minify CSS: saving 100-200ms
The page load breakdowns helped us identify that we had too many CSS files. There were separate CSS files for the responsive grid, modifiers, content, forms and media queries. This organisation makes life easy when you need to adjust the CSS of a website but for speed it is better to consolidate all these into one file.
To do this we simply copied and pasted the CSS from each individual file into one single file.
The important thing to remember when consolidating multiple CSS files is: the order that you add the code from each file must be the same as the order that the original files were linked from the webpage.
For example, originally the head section of each webpage linked to the stylesheets like this:
<!-- Styles -->
<link href="framework.css" rel="stylesheet">
<link href="general-modifiers.css" rel="stylesheet">
<link href="content.css" rel="stylesheet">
<link href="form.css" rel="stylesheet">
<link href="media-queries.css" rel="stylesheet">
We created a file called all-styles.css and copied the code from the framework.css file first, then after it add the code from general-modifiers.css file, then content.css etc., finishing with media-queries.css.
With the stylesheets consolidated it was time to minify the code.
Well written code is organised to be easy to read so it will include spacing, formatting and comments that are useful for the developer. Minifying simply removes everything that isn't actual code to be executed in order to reduce the filesize.
For example, this code:
/* registration form */

.registration-form {
	width: 100%;
}

.registration-form input[type="text"] {
	height: 36px;
}
When minified will become:
.registration-form{width: 100%;}.registration-form input[type="text"]{height: 36px;}
To minify our code we went over to CSS Minifier, pasted the code from the file into the Input CSS field and hit Minify. We then created a file called all-styles.min.css and pasted the minified code into it.
A word of warning here - many minifiers don't handle media-queries well. CSS Minifier dose convert normal media-queries well but it struggles with complex media-queries such as:
@media only screen and (-webkit-min-device-pixel-ratio: 2)
The minifier removes the spaces next to "only" and "and" which are essential. If your code contains complex media queries like this you'll need to add this spacing in manually. This is not a big problem and with search and replace just takes a couple of minutes.
With the CSS consolidated and minified it was just a case of updating the head of the webpages and uploading the new files to the server:
<!-- Styles -->
<link href="all-styles.min.css" rel="stylesheet">
Serve Font Awesome From CDN: saving 200-550ms
Font Awesome is a great way to provide icons for a website. It's quick and easy to work with and makes for a lighter, faster site. However, the font itself is quite large and was slow to load.
The solution was to serve Font Awesome from a content delivery network (CDN) - a network of servers across the globe that each have the Font Awesome files ready to serve to users closest to their location.
Using a CDN not only decreases load time of Font Awesome but also increases the likelihood of a user already having the Font cached on their computer even if they haven't visited the our site - if they've visited another site which uses the same CDN then Font Awesome should be on their computer already.
Their are several free CDNs that serve Font Awesome. In the past we've used Font Awesome's own CDN but found it unreliable (it regularly went down for several hours) so this time we opted for the Bootstrap CDN.
We went to https://www.bootstrapcdn.com/fontawesome/ and copied the link into the head of our webpages. We replaced this:
<!-- Icon Fonts -->
<link href="path-xxx/font-awesome/css/font-awesome.min.css" rel="stylesheet">
With this:
<!-- Icon Fonts -->
<link href="https://maxcdn.bootstrapcdn.com/font-awesome/4.7.0/css/font-awesome.min.css" rel="stylesheet" integrity="sha384-wvfXpqpZZVQGK6TAh5PVlGOfQNHSoD2xbE+QkPxCAFlNEevoEH3Sl0sibVcOQVnN" crossorigin="anonymous">
There is a downside to using a CDN and that is that if the CDN itself suffers downtime your site will be effected - in our case this would mean all the icons on the Downtime Monkey site disappearing! As ever though there is a solution: if the CDN fails, we'll serve a fallback copy.
In other words, if Font Awesome fails to load from the CDN then the webpage will revert to the copy of Font Awesome that is stored on our own server.
This is achieved by adding a few lines of JavaScript to the .js file which is included at the bottom of every web page:
// fallback function for Font Awesome
function ensureCssFileInclusion(cssFileToCheck) {
    var styleSheets = document.styleSheets;
    for (var i = 0, max = styleSheets.length; i < max; i++) {
        if (styleSheets[i].href == cssFileToCheck) {
            return;
        }
    }
    // because no matching stylesheets were found, we will add a new HTML link element to the HEAD section of the page.
    var link = document.createElement("link");
    link.rel = "stylesheet";
    link.href = "https://downtimmonkey.com/path-xxx/font-awesome/css/font-awesome.min.css";
    document.getElementsByTagName("head")[0].appendChild(link);
}

//call function
ensureCssFileInclusion("https://maxcdn.bootstrapcdn.com/font-awesome/4.7.0/css/font-awesome.min.css");
The function loops through the stylesheets that are included and if a stylesheet with a matching path to the Bootstrap CDN is present then no more code runs.
If however, there is no matching stylesheet that means that the CDN has failed and a link to the locally stored version of Font Awesome is added to the head of the webpage.
You can just copy and paste the code making sure to replace the URL of the fallback with the URL of your own fallback.
Async Load Google Fonts : saving 150-300ms
We use a Google Font called 'Cabin' for most of the text on Downtime Monkey.
Google Fonts enables websites to deliver varied typography without having to worry about compatibility - gone are the bad old days when websites were tied to Times New Roman and Arial.
The 'Cabin' font is loaded from Google's CDN and in the unlikely event that the Google CDN goes down (it's possibly the most reliable CDN on the planet), text is displayed in 'Sans Serif' instead... so no need for a JavaScript fallback.
However, 'Page Speed Insites' flagged up one issue that related to our use of Google fonts: Eliminate render-blocking JavaScript and CSS in above-the-fold content" was the recommendation.
The issue was that we linked the to Google Font from the head of the webpages like any other CSS file:
<!-- custom fonts -->
<link href="https://fonts.googleapis.com/css?family=Cabin" rel="stylesheet">
All the styles in the head of a webpage are loaded before the the page itself renders and each of the stylesheets effectively blocks the rendering of the page.
Asynchronous loading allows the page to begin rendering before a stylesheet is loaded - the page starts to load quicker but the downside is that all the styles aren't ready.
For this reason asynchronous loading is not good for many stylesheets - for example, if the styles for the Top Menu were loaded asynchronously the menu would first appear as a mess before changing to the correctly styled menu.
In many cases this makes for a bad user experience, however for a font the only visible effect will be a quick (0.2 second) flash of unstyled text as the page loads initially. In this case asynchronous loading gives a better user experience than a delay in page load.
To load the Google font asynchronously we used Web Font Loader which is a library developed jointly by Google and Typekit.
Web Font Loader is also hosted on the Google CDN - we headed to the Github Repository which has all the latest information and simply copy/pasted the following JavaScript into our .js file. The only edit we had to make was adding our font family, 'Cabin':
WebFontConfig = {
    google: { families: ['Cabin'] }
};

(function(d) {
	var wf = d.createElement('script'), s = d.scripts[0];
	wf.src = 'https://ajax.googleapis.com/ajax/libs/webfont/1.6.26/webfont.js';
	wf.async = true;
	s.parentNode.insertBefore(wf, s);
})(document);
Enable Gzip Compression: saving 100-400ms
When a file is compressed the information within the file is encoded using fewer bits and the filesize is reduced and smaller filesizes mean faster load times.
In fact, for speed gains vs effort required this was the best performing optimisation we made.
Compression is enabled at server level and there are several methods that can be used:
1) If you have a VPS or a dedicated server that runs Apache you can edit the Apache configuration http.conf file.
2)If you're on shared hosting you can edit the .htaccess file at the root of your website.
Simply add this code to either file:
<IfModule mod_filter.c>
    AddOutputFilterByType DEFLATE "application/atom+xml" \
                                  "application/javascript" \
                                  "application/json" \
                                  "application/ld+json" \
                                  "application/manifest+json" \
                                  "application/rdf+xml" \
                                  "application/rss+xml" \
                                  "application/schema+json" \
                                  "application/vnd.geo+json" \
                                  "application/vnd.ms-fontobject" \
                                  "application/x-font-ttf" \
                                  "application/x-javascript" \
                                  "application/x-web-app-manifest+json" \
                                  "application/xhtml+xml" \
                                  "application/xml" \
                                  "font/collection" \
                                  "font/eot" \
                                  "font/opentype" \
                                  "font/otf" \
                                  "font/ttf" \
                                  "image/bmp" \
                                  "image/svg+xml" \
                                  "image/vnd.microsoft.icon" \
                                  "image/x-icon" \
                                  "text/cache-manifest" \
                                  "text/calendar" \
                                  "text/css" \
                                  "text/html" \
                                  "text/javascript" \
                                  "text/plain" \
                                  "text/markdown" \
                                  "text/vcard" \
                                  "text/vnd.rim.location.xloc" \
                                  "text/vtt" \
                                  "text/x-component" \
                                  "text/x-cross-domain-policy" \
                                  "text/xml"
</IfModule>
We got this code from Github again - this time from the HTML5 Boiler Plate Server Configs repository which provides "a collection of boilerplate configurations that can help your server improve the web site's performance and security".
There are a whole range of config settings for many different types of server. These particular settings were taken from the Apache server configs, in the folder: 'src' > 'webperformance' > 'compression.conf'.
The repository is kept up to date so it is worth checking out to make sure you have the latest settings.
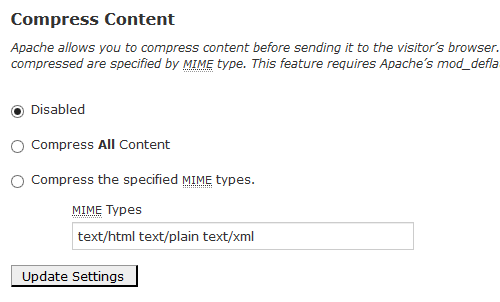
Note that another method is available to cPanel users. If the idea of editing code makes you squirm or you don't know where to find your .htaccess file then this is the best option: Login to cPanel and select 'Optimise website'. Choose 'Compress the specified MIME types', input the list of MIME types (e.g. text/html etc.) shown in the above code and hit 'update settings'.
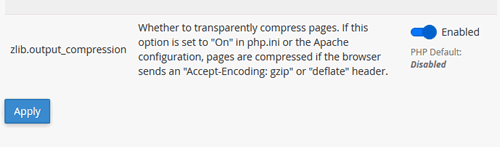
Note that this will compress most website files but not PHP files. Compression of PHP files was enabled by editing the PHP INI settings. This is easily done in cPanel: login and select 'MultiPHP INI Editor' and turn 'php_flag zlib.output_compression' to 'On'.
Optimise Images: saving 20-100ms
Modern cameras with tens of Megapixels take pictures that have massive filesizes - think megabytes rather than kilobytes. Trying to load a 3MB header image over the internet every time a webpage loads is a bad idea and can reduce page load to the speed of a sloth!
Our starting point was pretty good though: all images were already under 100kB, and most under 10kB. However, Page Speed Insites still flagged up that some of the images could be smaller.
There were two parts to our image optimisations - sizing and compression.
Image Sizing
Images with smaller dimensions have smaller filesizes. With that in mind we followed two rules:
1) Never place oversized images on the server and scale them down in the browser - this will cause slow page loads.
2) Never place undersized images on the server and scale them up in the browser - this will cause blurry images.
Our sizing optimisations involved finding the dimensions (in pixels) of the image when displayed on the webpage and making sure that the actual image that was stored on the server had the same dimensions.
When finding the display dimensions of responsive images, we used the image dimensions as displayed for desktop screens because these were the biggest dimensions needed for the particular image.
We were surprised to make some gains by resizing as we thought all our images had been sized correctly.
However, we'd used our logo on multiple pages through the website and on some pages only a small logo was needed (maximum size 26x26 pixels) but we loaded a larger one on the server (180x180 pixels). This was easily fixed by creating another image for the small logo that was just 26x26 pixels.
Image Compression
Our compression optimisation involved reducing the filesize of each image while maintaining the dimensions. Note that .jpg compression is 'lossy' so caused a reduction in visual quality, while .png compression is 'lossless' and visually the compressed image was identical to the uncompressed version.
A nice feature of Page Speed Insites is that when it runs, it creates a folder for download which contains optimised versions of all images that is deems too large. We looked at these images to see the filesize that we needed to achieve for each image.
Note that we didn't just go ahead and use the images produced by Page Speed Insites - better visual results can be achieved when a human looks at every image.
Image optimisation is a balance between visual quality and file size - images need to be as small as possible but still look sharp to the human eye. We compressed to the point just before an image lost visual quality.
To optimise our .jpg images we used Adobe Fireworks for both resizing and compression - it gives fine-grained control over image compression and quality. There are plenty of alternatives though - http://jpeg-optimizer.com is a good online optimiser that is easy to use.
To optimise .png images we used Fireworks for resizing and Pngyu for compression.
Pyngu is open source software which allows batch compression - we used this to compress a folder of images of flags of all countries in the world with one click.
After compression all our images were under 45kB, with most under 7kB.
Minify JavaScript: saving 0-10ms
Minifying JavaScript is basically the same as minifying CSS - removing all the whitespace, comments and other non-essentials from the code.
Our starting point for JavaScript was pretty good: a single .js file of just 4.5kB was included at the bottom of every webpage. Compared with writing scripts directly on the page this has the advantage of being cacheable.
Minifying the .js was really easy, in fact Page Speed Insites did it for us. When we analysed a page with the non-minified .js file a minified version was produced for download. Thanks!
Time wise this didn't gain us much because the file was already very small. However, for sites with a lot of JavaScript gains can be huge.
Enabling Browser Cacheing: saving 0 or 500-850ms
When browser cacheing is enabled on a server and a user visits the page, their computer will store some of the files that make up the webpage in the cache on their computer. If the user visits the site again then the files are loaded directly from the users computer saving a round trip to the server.
Therefore for 'first view' there are no gains in page speed by enabling cache. However, gains are huge when the user revisits the webpage or visits another webpage that uses the same files (i.e. any other page on the same website).
Similar to enabling compression, browser cache is enabled by file type at server level by editing the http.conf or the .htaccess files (assuming Apache).
We added this code to the http.conf file:
# Cache Control One year for image files
<filesMatch ".(jpg|jpeg|png|gif)$">
Header set Cache-Control "max-age=31536000, public"
</filesMatch>

# Cache Control One month for css and js
<filesMatch ".(css|js)$">
Header set Cache-Control "max-age=2628000, public"
</filesMatch>

# Cache Control One week for favicon cant be renamed
<filesMatch ".(ico)$">
Header set Cache-Control "max-age=604800, public"
</filesMatch>

#Cache Expires for Fonts 1 month
<IfModule mod_expires.c>
ExpiresActive on
# Embedded OpenType (EOT)
ExpiresByType application/vnd.ms-fontobject         "access plus 1 month"
ExpiresByType font/eot                              "access plus 1 month"

# OpenType
ExpiresByType font/opentype                         "access plus 1 month"
ExpiresByType font/otf                              "access plus 1 month"

# TrueType
ExpiresByType application/x-font-ttf                "access plus 1 month"
ExpiresByType font/ttf                              "access plus 1 month"

# Web Open Font Format (WOFF) 1.0
ExpiresByType application/font-woff                 "access plus 1 month"
ExpiresByType application/x-font-woff               "access plus 1 month"
ExpiresByType font/woff                             "access plus 1 month"

# Web Open Font Format (WOFF) 2.0
ExpiresByType application/font-woff2                "access plus 1 month"
ExpiresByType font/woff2                            "access plus 1 month"
</IfModule>
The first section contains 3 blocks of code which use Cache Control to set the length of time that specific filetypes are cached for. We set images to be cached for a year, CSS and JavaScript files to be cached for a month and favicons to be cached for just a week.
Note that if we do change the CSS or JavaScript on the site and it is essential that all users see the new version we can get round caching by changing the name of the file. For example we could rename all-styles.min.css to all-styles-2.min-css.
Although we don't intend on changing our favicon, a favicon file can't be renamed (it's always favicon.ico) so we used a shorter expiry time.
The second section of code uses Expires By Type to set the length of time that fonts (set by MIME type) should be cached for - in all cases we set fonts to be cached for a month.
For more information check out this webpage on Cache Control or visit the HTML5 Boiler Plate Server Configs repository on Github, specifically: Apache server configs, in the folder: 'src' > 'webperformance' > 'expires_headers.conf'.
YouTube Video: No Change
The embedded YouTube video was the slowest aspect of the home page but we didn't change it.
It is possible to 'lazy load' YouTube videos by replacing the video with an image and loading the video when the user clicks the image.
But we didn't do it - we must be the lazy ones, right?
No! The first, and most important reason we didn't lazy load the video is that embedded videos provide SEO juice but there is no SEO benefit if 'lazy loading' is used. The second reason is that the video is below the fold and by the time a user has scrolled down the video will be completely loaded.
Results
After making all these changes we ran our benchmark pages through Web Page Test again - this time we selected 'First View and Repeat View' from the Advanced Settings, so that we could see the effects of cacheing.
Before Optimisation:
Plans Page: 2.105 seconds, Home Page: 2.712 seconds.
After Optimisation, First View:
Plans Page: 1.288 seconds, Home Page: 2.466 seconds.
After Optimisation, With Cache:
Plans Page: 0.876 seconds, Home Page: 1.664 seconds.
The best result was a 58% improvement (repeat view of the Plans page) and the worst result was a 9% improvement (first view of the Home page).
We're pretty happy with the first view results for the Plans page - the 39% improvement in page speed is reflected in many of the pages across the site.
We're also happy with improvements in the home page - everything except for the YouTube video is loaded in under 1.3 seconds.
Here are the 'first view' waterfall diagrams after optimisation:
All Posts
Website Monitoring Prices Compared
Scheduled Maintenance 17th June 2021
US Text Alerts Updated For 10DLC
A Quick Study Of Response Time
'Early-bird' Discount Ends November
Downtime Logs... All In One Place
The Effects Of COVID-19 Lockdowns
Lockdown Bugfixes & Midnight Coding
Monitoring URLs With Query Strings
New Pro Plans For EU Individuals
Free & Pro Monitoring Compared
Downtime Alerts: An Ideal Custom Setup
Server Upgrade & IP Address Change
Website Monitoring: Cheap vs Free
Website Content (Keyword) Monitoring
Cheap Website Monitoring Pro Plans
Server Upgrade Scheduled Completed
Whitelist Email Addresses in cPanel
Website Downtime Alerts To Slack
Whitelist Email Addresses: Thunderbird
Whitelist Email Addresses in Yahoo Mail
How we improved accessibility by 42%
Whitelist Email Addresses in Outlook
Whitelist Email Addresses In Gmail
Why Whitelist An Email Address?
When is a website considered down
Bulk import, edit and delete monitors
Privacy, democracy & bureaucracy
How Much Downtime is Acceptable?
Server Upgrade Scheduled Completed
Free Plan Upgraded to 60 Monitors
New Feature: Rate Limit SMS Alerts
How We Boosted Page Speed By 58%
How To Reduce Website Downtime