Downtime Logs... All In One Place
17 Aug 2020
The stats overview page that we launched in June was very well received. We have followed up on this and developed a similar idea for downtime logs. This went live on Friday and shows downtime records for all your monitors in one place.
Filter Logs
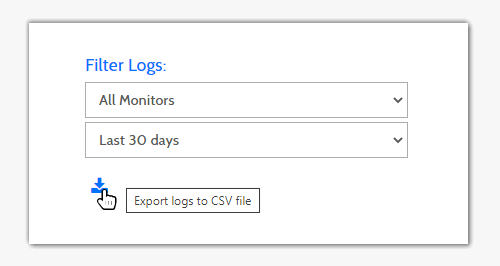
By default, logs of all downtimes in the last 24 hours are shown. This means that you'll immediately see downtimes from any recent outages and get the important details at a glance.
It's possible to show logs for any site individually. This is really handy if you monitor a lot of websites and want to focus in on one particular site.
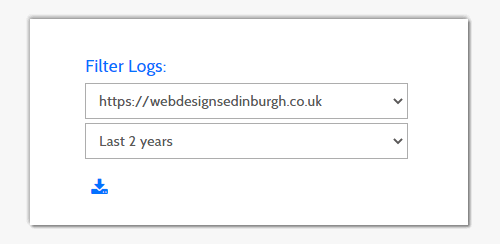
You can also change the timespan to see logs up to 2 years old: options are 24 hours, 7 days, 30 days, 90 days, 1 year and 2 years. You can view logs for all your monitors together for up to 30 days - for more than this select an individual site.
Download Logs
As well as viewing logs you can export logs to a spreadsheet (CSV file) in just one click. This is really useful if you want to send logs to a customer, provide evidence of downtimes to a hosting provider or include logs in a company report.
View Timestamps in your Timezone
In every log, timestamps of the start and end of the downtime are shown. These are displayed in your preferred timezone and exactly match the timestamp shown in the corresponding downtime alerts.
This makes it incredibly easy to cross-reference a log with a particular alert as shown in this recent post on timestamps on downtime alerts.
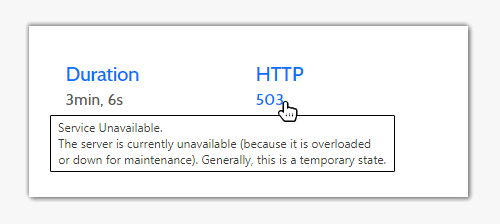
See the Reason For Every Downtime
The HTTP code is shown in each log and you can hover on this to see the cause of the downtime in plain English. This can help you troubleshoot problems and get your website back online quickly.
A big thank you to everyone using Downtime Monkey and especially to our Pro users - it wouldn't be possible without you!
All Posts
Website Monitoring Prices Compared
Scheduled Maintenance 17th June 2021
US Text Alerts Updated For 10DLC
A Quick Study Of Response Time
'Early-bird' Discount Ends November
Downtime Logs... All In One Place
The Effects Of COVID-19 Lockdowns
Lockdown Bugfixes & Midnight Coding
Monitoring URLs With Query Strings
New Pro Plans For EU Individuals
Free & Pro Monitoring Compared
Downtime Alerts: An Ideal Custom Setup
Server Upgrade & IP Address Change
Website Monitoring: Cheap vs Free
Website Content (Keyword) Monitoring
Cheap Website Monitoring Pro Plans
Server Upgrade Scheduled Completed
Whitelist Email Addresses in cPanel
Website Downtime Alerts To Slack
Whitelist Email Addresses: Thunderbird
Whitelist Email Addresses in Yahoo Mail
How we improved accessibility by 42%
Whitelist Email Addresses in Outlook
Whitelist Email Addresses In Gmail
Why Whitelist An Email Address?
When is a website considered down
Bulk import, edit and delete monitors
Privacy, democracy & bureaucracy
How Much Downtime is Acceptable?
Server Upgrade Scheduled Completed
Free Plan Upgraded to 60 Monitors
New Feature: Rate Limit SMS Alerts
How We Boosted Page Speed By 58%
How To Reduce Website Downtime