Stats At A Glance
19 Jun 2020
We've just rolled out another new feature: a 'Stats Overview' area where you can view a summary of the stats for all your monitors at a glance. There have been several requests for this feature from customers who want to view the most important stats for their websites in one place.
Here are the details...
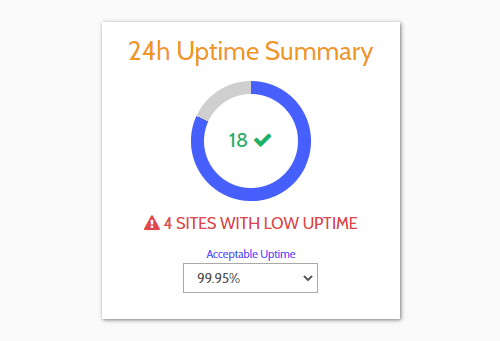
24 hour Uptime Summary
At the top of the page you'll find the uptime summary which shows the number of sites with 'good' uptime and the number of sites with 'low' uptime, over the past 24 hours.
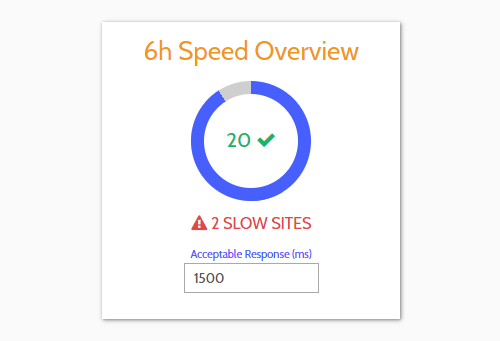
6 hour Speed Summary
Alongside the uptime summary you'll find the website speed summary. This shows the number of sites that are running well and the number of 'slow' sites, based on the average response time over the last 6 hours.
Stats List For All Monitors
Next is a list of all monitors with their pertinent stats and links to in-depth stats and logs. Sites with low uptime and slow sites are listed first so you won't need to scroll to find them.
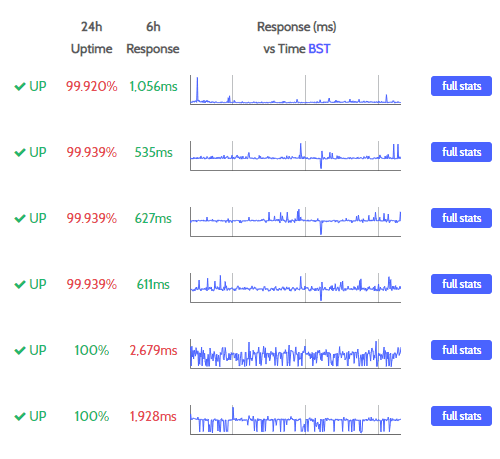
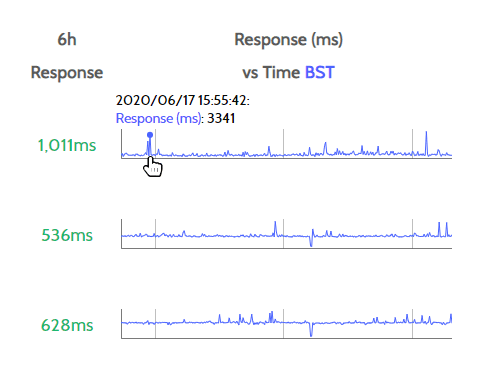
Alongside the stats, you'll see graphs of response times for the last 6 hours. These are interactive so you can view the details of every individual response.
Set Your Timezone
The default timezone to display stats is UTC but it's very easy to change, simply:
1) Navigate to 'locations'
2) Select your preferred timezone from the dropdown menu
All response times and downtime logs will now be shown in the timezone of your choice.
Configure Acceptable Uptime
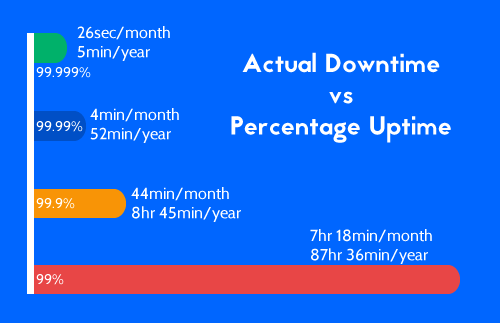
We realise that what constitutes 'good' uptime is subjective. Therefore we have made the acceptable uptime configurable.
Options are: 99%, 99.5%, 99.9%, 99.95%, 99.99%, 99.995% and 99.999%.
The default acceptable uptime is 99.95%, the average result taken from our acceptable uptime survey, but the choice is yours...
Configure Acceptable Response Time
Again, what constitutes 'slow' response time is subjective so we have made the acceptable response time configurable. You can set any value up to 17,000 milliseconds.
The default is 1,500 milliseconds although we recommend that you set your own value, because response time varies with different websites, servers and locations.
A good way to choose a value is to allow monitors to run for a short period to see what a 'normal' response time is for your websites, and then set the acceptable response time just above this figure. With this method, if a site runs more slowly than usual it will be highlighted as a 'slow' site, enabling you to locate problems before they cause actual downtime.
Note that Downtime Monkey measures response time as 'time to receive headers' which is different from the commonly quoted 'time to first byte'. We believe that time to headers is a better measure of response time because headers are received immediately before the first content is loaded to the web browser whereas the first byte is received some time in advance of this so can give an artificially low result (more info here).
A big thank you to those who have taken the time to submit feature requests - you have helped us improve Downtime Monkey!
All Posts
Website Monitoring Prices Compared
Scheduled Maintenance 17th June 2021
US Text Alerts Updated For 10DLC
A Quick Study Of Response Time
'Early-bird' Discount Ends November
Downtime Logs... All In One Place
The Effects Of COVID-19 Lockdowns
Lockdown Bugfixes & Midnight Coding
Monitoring URLs With Query Strings
New Pro Plans For EU Individuals
Free & Pro Monitoring Compared
Downtime Alerts: An Ideal Custom Setup
Server Upgrade & IP Address Change
Website Monitoring: Cheap vs Free
Website Content (Keyword) Monitoring
Cheap Website Monitoring Pro Plans
Server Upgrade Scheduled Completed
Whitelist Email Addresses in cPanel
Website Downtime Alerts To Slack
Whitelist Email Addresses: Thunderbird
Whitelist Email Addresses in Yahoo Mail
How we improved accessibility by 42%
Whitelist Email Addresses in Outlook
Whitelist Email Addresses In Gmail
Why Whitelist An Email Address?
When is a website considered down
Bulk import, edit and delete monitors
Privacy, democracy & bureaucracy
How Much Downtime is Acceptable?
Server Upgrade Scheduled Completed
Free Plan Upgraded to 60 Monitors
New Feature: Rate Limit SMS Alerts
How We Boosted Page Speed By 58%
How To Reduce Website Downtime