The Effects Of COVID-19 Lockdowns
23 May 2020
On Website Downtime
In early March we noticed an increase in the overall number of downtimes logged at Downtime Monkey. This was when COVID-19 related lockdowns were beginning in many countries so we decided to dig into the data to see if there was a correlation. Here are the results...
The Graphs
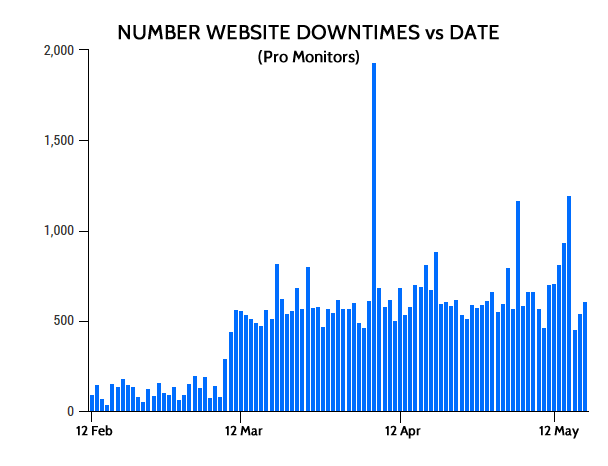
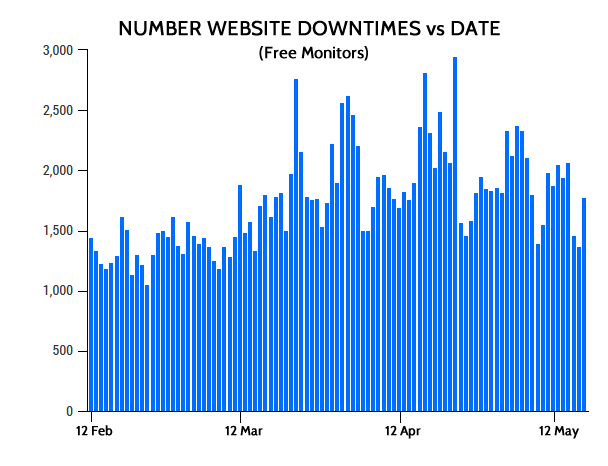
The top two graphs show the total number of downtimes that occurred each day from 12 February 2020 to 18 May 2020 for websites monitored by Downtime Monkey. The top graph shows data from the Pro monitoring service while the second graph shows data from the Free service.
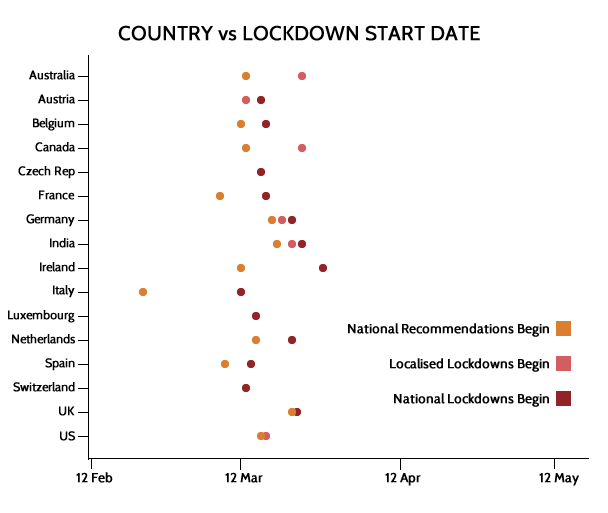
The third graph shows dates that COVID-19 related lockdown measures began in 16 countries.
The Data
Criteria for a 'downtime'
Both Free and Pro services use http monitoring to detect downtimes. Any website that responds with an http response that is not 20x (e.g. 200 OK) is logged as down. Also, if a website doesn't respond within 17 seconds it is recorded as down due to timeout.
Note that for the purposes of this study we haven't distinguished between downtimes of different duration - a site that is down for 1 minute and a site that is down for one hour are each counted as a single downtime.
Sample sizes
Free monitors: approximately 2000 websites submitted by 1000 users located all over the world.
Pro monitors: approximately 700 websites submitted by 40 users located mainly in North America, Europe and Australia/New Zealand.
Note that the number of monitors grew during the study. Specifically, increases of approximately 30% for Free monitors and 25% for Pro monitors occurred.
The increase in Free monitors was fairly linear with a few monitors added most days and the largest number of monitors (66) added on 20 April. The increase in Pro monitors was sporadic, with only 32 days where new monitors were added. The majority of new monitors (223) were added in a single day on 3 April.
Data differences between Free and Pro services
Free monitoring takes place solely from Downtime Monkey's main server in London, while the Pro service provides the option to use some, or all, of our global network of servers to prevent false positive downtimes. Without global monitoring, false positive downtimes can be caused by the network being down between our server in London and the website's server.
It's worth noting that the majority of sites monitored by the Pro service have at least one global server allocated, therefore network problems will have minimal effect on the Pro data while the Free monitoring data will include some false positive downtimes caused by network problems.
Lockdown Start Dates
Lockdown start dates were obtained from the Oxford Coronavirus Government Response Tracker. For simplicity the data was limited to 16 countries that are known to be home to a large number of web hosting servers. A more exhaustive range of lockdown dates by country is shown here.
Conclusion & Discussion
National recommendations and lockdowns largely began between 9 and 24 March.
Pro monitoring results show a very distinct stepped increase in downtimes between 9 and 11 March. As expected Free monitoring results are more noisy, but nonetheless show a significant increase in downtimes between 12 and 23 March.
It can be tentatively concluded that a correlation exists between COVID-19 related lockdown and increased website downtime. It will be interesting to confirm this by revisiting the study as countries gradually remove lockdown measures in the coming weeks and months.
Correlation or Causation?
Although a correlation has been shown it is not possible to prove causation here. However, it doesn't require a huge leap of logic to see that hosting providers may struggle to deal with problems efficiently when working with skeleton staff.
All Posts
Website Monitoring Prices Compared
Scheduled Maintenance 17th June 2021
US Text Alerts Updated For 10DLC
A Quick Study Of Response Time
'Early-bird' Discount Ends November
Downtime Logs... All In One Place
The Effects Of COVID-19 Lockdowns
Lockdown Bugfixes & Midnight Coding
Monitoring URLs With Query Strings
New Pro Plans For EU Individuals
Free & Pro Monitoring Compared
Downtime Alerts: An Ideal Custom Setup
Server Upgrade & IP Address Change
Website Monitoring: Cheap vs Free
Website Content (Keyword) Monitoring
Cheap Website Monitoring Pro Plans
Server Upgrade Scheduled Completed
Whitelist Email Addresses in cPanel
Website Downtime Alerts To Slack
Whitelist Email Addresses: Thunderbird
Whitelist Email Addresses in Yahoo Mail
How we improved accessibility by 42%
Whitelist Email Addresses in Outlook
Whitelist Email Addresses In Gmail
Why Whitelist An Email Address?
When is a website considered down
Bulk import, edit and delete monitors
Privacy, democracy & bureaucracy
How Much Downtime is Acceptable?
Server Upgrade Scheduled Completed
Free Plan Upgraded to 60 Monitors
New Feature: Rate Limit SMS Alerts
How We Boosted Page Speed By 58%
How To Reduce Website Downtime